
Page 3 - Annual report 2018 of the Böllhoff Group
P. 3
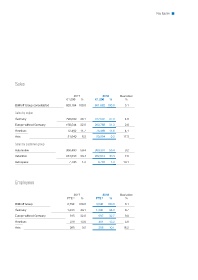
Key figures


          Sales


                                             2017              2018      Deviation
                                         €1,000   %       €1,000   %        %
          Böllhoff Group consolidated    620,184 100.0    651,682 100.0     5.1

          Sales by region
          Germany                        298,099  48.1    312,542  47.9     4.8
          Europe without Germany         198,544  32.0    203,768  31.3     2.6

          Americas                        72,492  11.7     75,468  11.6     4.1
          Asia                            51,049  8.2      59,904   9.2    17.3

          Sales by customer group
          Automotive                     368,400  59.4    380,307  58.4     3.2
          Industries                     244,038  39.4    262,612  40.3     7.6
          Aerospace                        7,746  1.2       8,763   1.3    13.1


          Employees


                                             2017              2018      Deviation
                                          FTE  7)  %       FTE  7)  %       %
          Böllhoff Group                  2,792  100.0     3,046  100.0     9.1
          Germany                         1,233  44.1      1,340   44.0     8.7

          Europe without Germany            915  32.8        997   32.7     9.0
          Americas                         379   13.6        401   13.2     5.8
          Asia                             265    9.5        308   10.1    16.2