Page 2 - Annual report 2018 of the Böllhoff Group
P. 2

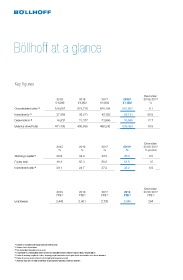
Böllhoff at a glance


          Key figures


                                                                                        Deviation
                                   2015          2016         2017          2018 1)     2018/2017
                                   €1,000       €1,000        €1,000       €1,000          %
          Consolidated sales  2)  516,807       574,718      620,184       651,682         5.1

          Investments  3)          37,358        35,211       43,183        65,131        50.8
          Depreciation  4)         16,932        21,377       23,556        26,555        12.7
          Balance sheet total     411,736       458,636      486,242       539,363        10.9


                                                                                        Deviation
                                   2015          2016         2017          2018 1)     2018/2017
                                    %             %            %             %           % points
          Working Capital  5)      36.9          34.4         33.5          36.0           2.5
          Equity ratio             49.4          53.3         56.0          54.5           -1.5

          Investment ratio  6)     29.1          24.7         27.2          33.2           6.0


                                                                                        Deviation
                                   2015          2016         2017          2018        2018/2017
                                   FTE  7)       FTE  7)      FTE  7)       FTE           FTE
                                                                                             7)
                                                                               7)
          Employees                2,445         2,601        2,792         3,046          254


          1) Based on audited individual financial statements
          2) Before sales deductions
          3) Not including financial investments
          4) Depreciation of intangible fixed assets and tangible assets without extraordinary depreciation
          5) Ratio of working capital to sales; working capital includes stock plus trade receivables less trade liabilities
          6) Ratio of investments to fixed assets (without financial assets)
          7) Average number of staff in full-time employment including contract workers
   1   2   3   4   5   6   7