
Page 3 - Jahresbericht 2018 der Böllhoff Gruppe
P. 3
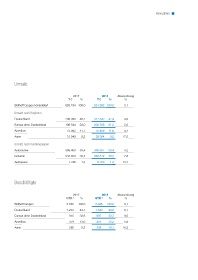
Kennzahlen


          Umsatz


                                             2017             2018      Abweichung
                                          T€     %         T€     %         %
          Böllhoff Gruppe konsolidiert  620.184 100,0     651.682 100,0     5,1

          Umsatz nach Regionen
          Deutschland                   298.099  48,1     312.542  47,9     4,8
          Europa ohne Deutschland       198.544  32,0     203.768  31,3     2,6

          Amerikas                       72.492  11,7      75.468  11,6     4,1
          Asien                          51.049   8,2      59.904  9,2     17,3

          Umsatz nach Kundengruppen
          Automotive                    368.400  59,4     380.307  58,4     3,2
          Industrie                     244.038  39,4     262.612  40,3     7,6
          Aerospace                       7.746   1,2       8.763  1,3     13,1


          Beschäftigte


                                             2017             2018      Abweichung
                                             7)               7)
                                         GTK     %        GTK     %         %
          Böllhoff Gruppe                2.792  100,0     3.046  100,0      9,1
          Deutschland                    1.233   44,1     1.340   44,0      8,7

          Europa ohne Deutschland           915  32,8      997    32,7      9,0
          Amerikas                         379   13,6      401    13,2      5,8
          Asien                            265    9,5      308    10,1     16,2